

 Poland
 Paid Advertising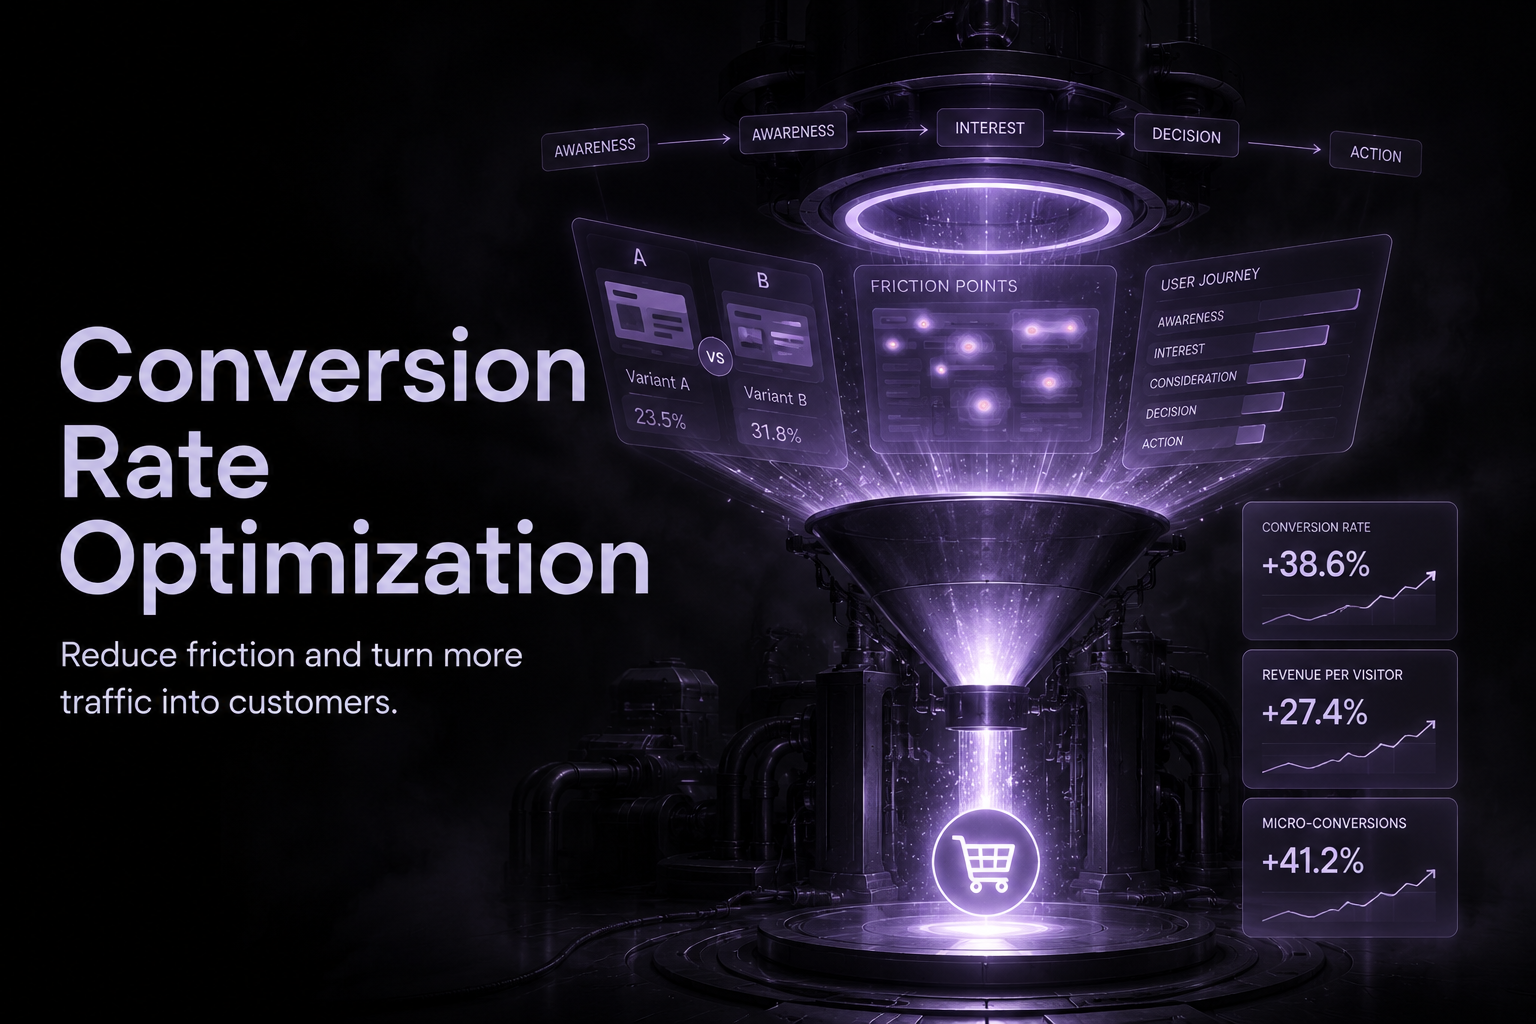
Conversion rate optimization covers A/B testing, UX audits, and funnel analysis used to increase the share of visitors who become customers.
A site with strong traffic and a weak conversion rate is spending its marketing budget twice over - once to earn the visit, again in the revenue left on the table when it doesn't convert. Pixelique's CRO work is built to close that second gap.
Behavioral data and user research tell us where people actually drop off, not where we assume they might. For checkout flows, that includes checking whether payment options match what shoppers expect at that step, since a missing preferred method is a common reason carts get abandoned.
A conversion rate that doubles effectively doubles revenue from the same traffic - no extra ad spend required. That leverage is why CRO tends to outperform most other line items on a marketing budget.
Strategic Advantages of Conversion Rate Optimization
Opinions about why a page underperforms are cheap; data about why visitors actually leave is what CRO trades in instead.
Nothing ships on a hunch. Every change is tested and measured, so you know precisely what moved and why before it becomes permanent.
- Heatmap & User Behavior Analysis
- A/B Testing & Multivariate Testing
- Landing Page Optimization
- Checkout & Funnel Optimization
- UX Audit & Friction Removal
- Conversion Tracking & ROI Reporting

Our Process for Conversion Rate Optimization
Diagnosis comes before any fix - the point is to know what's actually broken before spending a testing cycle on a guess.
step 01
Research & Diagnosis
Heatmaps, session recordings, and funnel analytics show where visitors actually hesitate or leave - the specific friction points, not a generic list of "best practice" fixes.
step 02
Testing & Experimentation
Headlines, CTAs, layouts, and checkout flows get tested against a clear hypothesis, not just changed and hoped for - each test runs until the result is statistically solid enough to act on.
step 03
Implementation & Scaling
A winning variation gets made permanent, then we move to the next opportunity on the list - conversion rate compounds gradually rather than jumping once and plateauing.
Ready to convert more of your existing traffic? Get a free CRO audit - we'll identify the leaks in your funnel and show you how to fix them.
Get My Free AuditFAQs about Conversion Rate Optimization
Conversion Rate Optimization (CRO) is the systematic process of increasing the percentage of website visitors who take a desired action, such as making a purchase, filling out a form, booking a call, or subscribing to a newsletter.
Your conversion rate is calculated as: (Conversions ÷ Visitors) × 100. If 1,000 people visit your site and 20 make a purchase, your conversion rate is 2%. CRO focuses on increasing that percentage through research, testing, and optimization, so more of your existing traffic generates revenue without needing to increase ad spend.
We use a combination of quantitative and qualitative research methods to pinpoint exactly what to test:
- Google Analytics & GA4: Funnel analysis, drop-off rates, and traffic behavior
- Heatmaps & Click Maps: Where users click, scroll, and lose interest
- Session Recordings: Real user sessions that reveal confusion and friction
- User Surveys: Direct feedback on why visitors did or didn't convert
- Form Analytics: Identifying which fields cause abandonment
CRO results depend on your website traffic volume and the tests being run. A single A/B test typically requires 2–4 weeks to reach statistical significance with sufficient traffic. Lower-traffic sites may take longer to accumulate enough data for reliable results.
That said, some quick wins, like fixing broken buttons, clarifying CTAs, or removing unnecessary form fields, can deliver immediate improvements within days. CRO is most powerful as an ongoing practice: each test builds on the last, compounding improvements over time into significantly higher conversion rates.
Results vary by industry, starting conversion rate, and website quality, but here is the context we work within:
- The average website converts only 2–3% of its visitors - a low bar most sites can beat
- In Poland, about 75% of online carts are abandoned before checkout - a direct recovery opportunity
- Most winning A/B tests lift conversions 10–20%, and we compound those gains test after test