

 United Arab Emirates
 Paid Advertising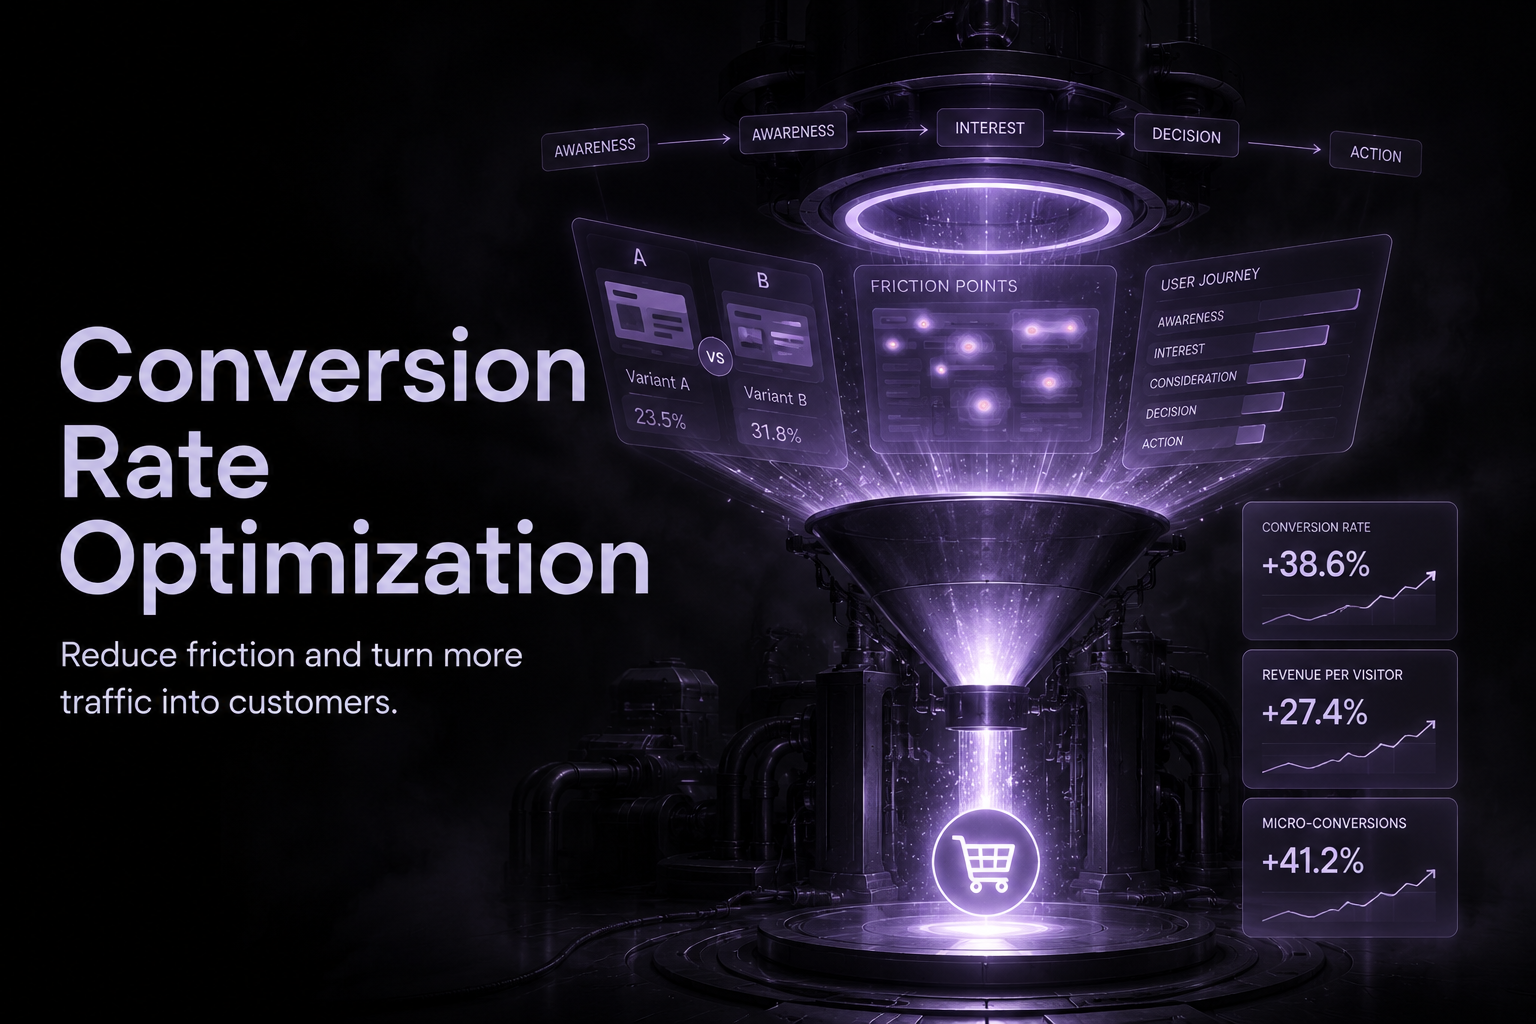
CRO is the discipline of A/B testing, UX audits, and funnel analysis aimed at turning more of your existing visitors into paying customers.
Traffic is the easy part to buy - getting that traffic to actually act is the harder, more valuable work. Our Pixelique CRO service focuses on squeezing more value out of the visitors you're already paying to attract.
Rather than guessing why people leave without converting, we use behavioral data and testing to pin down the exact point they drop off, then design a fix and validate it against real traffic.
Improving your conversion rate is one of the few levers that grows revenue without growing ad spend - the same traffic simply converts at a higher rate.
Strategic Advantages of Conversion Rate Optimization
Instead of relying on gut instinct about what's wrong with a page, CRO replaces that guesswork with data that shows exactly where the friction is.
Every change gets tested before it's called a win, so you know what actually moved the numbers rather than assuming.
- Heatmap & User Behavior Analysis
- A/B Testing & Multivariate Testing
- Landing Page Optimization
- Checkout & Funnel Optimization
- UX Audit & Friction Removal
- Conversion Tracking & ROI Reporting

Our Process for Conversion Rate Optimization
Diagnosis always comes before a fix - no changes get made based on a hunch, every recommendation traces back to actual user data.
step 01
Research & Diagnosis
Heatmaps, session recordings, and funnel data get combined to show exactly where visitors stall out and, often, why. That research surfaces the specific friction points quietly costing you conversions.
step 02
Testing & Experimentation
Findings translate into structured A/B tests on the elements most likely to move the needle: headlines, CTAs, layouts, forms, checkout flow. Each test runs on a clear hypothesis until the results are statistically solid.
step 03
Implementation & Scaling
Whatever wins gets made permanent, and we move to the next opportunity on the list. It's a cycle that keeps compounding, with a monthly report tying each change back to actual revenue impact.
Wondering where your funnel is leaking? Get a free CRO audit and we'll show you exactly where visitors are dropping off.
Get My Free AuditFAQs about Conversion Rate Optimization
It's the structured process of getting more visitors to complete whatever action matters - a purchase, a form fill, a booked call - without needing more traffic to do it.
The math is simple: (Conversions ÷ Visitors) × 100. A thousand visitors and 20 purchases works out to a 2% rate. CRO chips away at that percentage through research and testing, so the traffic you're already getting works harder.
A mix of quantitative and qualitative research narrows down what's actually worth testing:
- GA4: Funnel drop-off and traffic behavior patterns
- Heatmaps and click maps: Where attention goes, and where it fades
- Session recordings: Watching real visits reveals confusion that numbers alone don't show
- Surveys: Direct answers on why someone didn't convert
- Form analytics: Which specific fields cause people to abandon
It depends heavily on your traffic volume. A single A/B test usually needs 2–4 weeks to hit statistical significance; lower-traffic sites take longer to gather enough data.
That said, obvious fixes - a broken button, a confusing CTA, an unnecessary form field - can show impact within days. The real value shows up over time, as each test builds on the last and improvements start compounding.
It varies a lot by industry and where you're starting from, but here's the realistic picture worth starting from:
- The average website converts only 2–3% of its visitors - a low bar most sites can beat
- In the UAE, roughly 78% of online carts are abandoned before checkout - higher than the ~70% global average, and a direct recovery opportunity
- Most winning A/B tests lift conversions 10–20%, and we compound those gains test after test